

AntV Infographic
markstream-vue supports rendering AntV Infographic charts.
1. Installation
This feature depends on the @antv/infographic library.
npm install @antv/infographicConfigure the optional loader in your app entry before app.mount() or before the first infographic block is rendered:
// main.ts
import { setInfographicLoader } from 'markstream-vue'
import { createApp } from 'vue'
import App from './App.vue'

setInfographicLoader(() => import('@antv/infographic'))

createApp(App).mount('#app')
Migration note: infographic rendering is now explicit opt-in. If your app previously relied on charts working automatically after installing @antv/infographic, keep the package installed and add the loader setup above.
2. Example
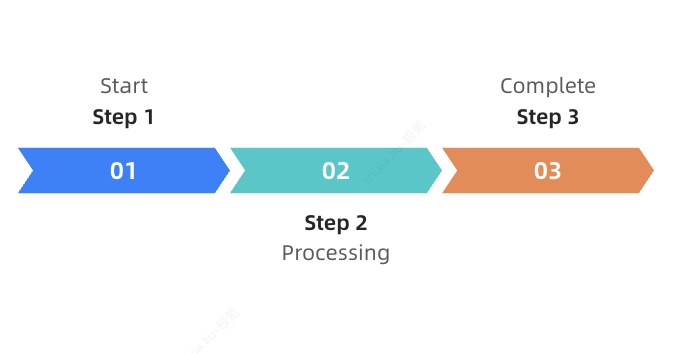
Use the infographic code block in Markdown to render charts:
```infographic
infographic list-row-simple-horizontal-arrow
data
  items
    - label Step 1
      desc Start
    - label Step 2
      desc Processing
    - label Step 3
      desc Complete
```
Panning works the same way as the Mermaid block: drag anywhere in the preview to move the chart, and keep dragging past the edge of the preview box — the gesture follows the pointer after it leaves the box. Touch pans only once the chart is zoomed in (at fit zoom the whole chart is visible, so a swipe keeps scrolling the page); the fullscreen modal always pans on touch. Every framework package (Vue 3, Vue 2, React, Svelte, Angular, Octane) shares one implementation through createPanGesture from markstream-core.
3. Resources
- AntV Infographic Official Website - Explore more chart templates and syntax details.